Hello everyone in this article we going to see Does price action work on crypto trading? Let’s begin with it, As we all know, price action plays an important role in the field of trading, whether it’s a stock market, commodity market, or forex market. In this article, we are going to know that Does price action work in the field of crypto trading or not? The answer is yes price action works in each market. Price is one of the best ways to do price prediction of stocks, commodities, Forex, etc.
Yes, price action work in crypto trading. It describes the characteristics of a crypto’s price movements. This movement is quite often analyzed concerning price changes in the recent past. In simple terms, price action is a trading technique that allows a trader to read the market and make subjective trading decisions based on current and actual price movements, rather than relying solely on technical indicators.

Tools that are used in price action for crypto trading
Price action trading relates to recent historical data and past price movements, in this all technical tools like charts, trend lines, price bands, high and low swings, technical levels (of support, resistance, and consolidation), etc. are taken into consideration by traders to traders depending on their choices.
The tools and patterns observed by the trader can be simple price bars, price bands, breakouts, breakdowns, consolidation, trendlines, candlesticks, volatility, channels, etc. these are tools that help to relate price movement.
In price action trading, traders’ behaviors and psychology also play an important role. In essence, price action trading is a systematic trading practice, aided by technical analysis tools and recent price history, where traders are free to take their own decisions within a given scenario to take trading positions, as per their subjective, behavioral, and psychological state.
Who Uses Price Action Trading?
Since the price action trading technique is used for price predictions and speculation, it is mainly used by retail traders, arbitrageurs, speculators, and even trading firms use this technique. It is a technique that is used in various securities including forex, crypto, equities, commodities, etc.
Price Action Trading Steps for crypto
Any experienced trader always goes with price action, they always look at charts to mark their important level. Important levels in the field of trading are entry-level, exit-level, and stop loss. The entry and exit levels are based on chart patterns, there are different types of chart patterns are used by traders to mark important levels. Trading crypto is highly risky because its movement is quite fast compared to other trading securities. You should focus on risk management in any trading securities if you want to be profitable.
Different types of chart patterns used in crypto trading
Chart patterns are an integral aspect of technical analysis, but they require some practice before getting used. A chart pattern is a shape within a price chart that helps to suggest what prices might do next, based on what they have done in the past. Chart patterns are the basis of technical analysis and require a trader to know exactly what they are looking at, as well as what they are looking for. To help you, here are the 6 most important chart patterns every trader needs to know.
- Head and shoulder
- Double top
- Double bottom
- Ascending triangle
- Descending triangle
- Symmetrical triangle
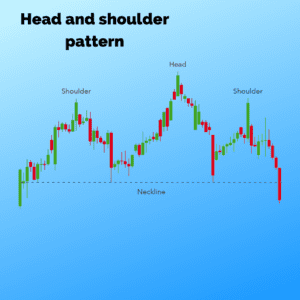
Head and shoulder
In this pattern, a candlestick forms a head and shoulder-like structure. We took only entry when it’s neck-like break and the candle gives closing below the neckline, then only trade will activate. The neckline is a demand zone.
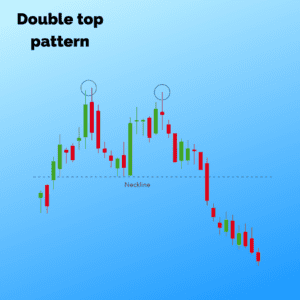
Double top
In this pattern, candlesticks form a double-top pattern structure, as you can see in the chart below. The double top pattern will get activated when the demand zone gets a breakdown, demand zone i.e, NECKLINE.
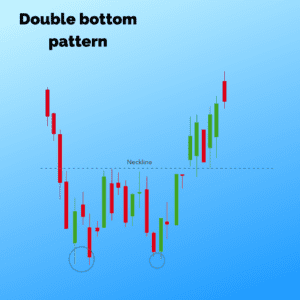
Double bottom
In this pattern, candlesticks form a double-bottom pattern structure, as you can see in the chart below. The double bottom pattern will get activated when the supply zone gave a breakout, supply zone i.e, NECKLINE.
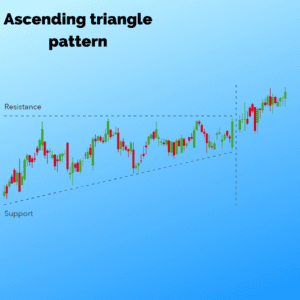
Ascending triangle
In Ascending triangle pattern there is a horizontal resistance and also a trendline that behaves like support. As you can see in the chart below, in ascending triangle patterns breakout and breakdown both can happen. Depending upon the breakout we take the trade.
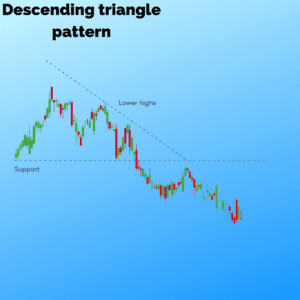
Descending triangle
In descending triangle pattern there is a horizontal support level and also a trendline that behaves as a resistance. As you can see in the chart below, in descending triangle patterns breakout and breakdown both can happen. Depending upon the breakout we take the trade.
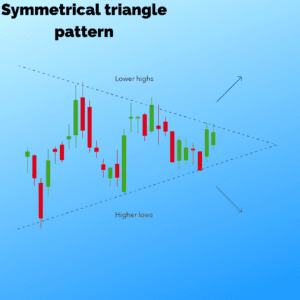
Symmetrical triangle
In a symmetrical triangle pattern, the candle sticks form in such a way that it looks like a symmetrical triangle. In this type of pattern, there is a probability of a breakout on both sides either upside or downside. It is easy to trade such type of pattern. As you can see in fig.
What Does Price Action Tell You?
When a trader knows technical analysis he searches for chart patterns and some indicators that help to predict how security will behave in the future and to time entry and exit points of trades. Many tools like moving averages and oscillators are derived from price action and projected into the future to inform traders. These price action work on crypto trading if you use this technique.
What Are Some Limitations of Using Price Action?
The limitation is that past price action is not always a valid predictor of future outcomes. As a result, technical traders should employ a range of tools to confirm indicators and be prepared to exit trades quickly if their predictions prove incorrect. Therefore if you are following price action you should focus on Risk management to be profitable.
If you are new to crypto and want to invest here’s the best way you can invest in it read till the end you will get the best knowledge.
Conclusion
Candlestick patterns are an important part of price action trading. These chart patterns are essentially reoccurring formations in price action that traders can identify and use to create actionable trade ideas. The idea behind this trading strategy is that these patterns tend to play out in similar ways, so the trade ideas created based on them may have a high probability of success.
Frequently Asked Questions
How can I learn price action trading?
Which type of trading is best? is one of the easiest method and most professional methods of trading either in the stock market or in the crypto market or forex market or the commodities market. In this, you have to focus on the charts and find some patterns which help you to find a good trade. Chart patterns help you to find important levels. Make sure that you are familiar with the charred pattern.
What is the most successful chart pattern?
Flag and pole are among the most popular chart patterns used in technical analysis since they didn’t occur frequently compared to other patterns. The three most common types of triangles are symmetrical triangles, ascending triangles, and descending triangles. But before taking any trade make sure there is consolidation.
Which type of trading is best?
If you are looking for the best trading, there is no answer about best trading it depends from trader to trader. If you’re comfortable with intraday go with it otherwise swing trading is more comfortable but it requires more capital.